QGIS Modelling for Direction and Distance
In the first lab, we created a model to calculate direction and distance from a point. A model like this can be useful to visualize geographic theories such as the Bid Rent Model, and understand how phenomena change across space in relation to a city center. For our purposes, we calculated direction and distance of city tracts from a central business district to look at the distribution of median gross rent around a city center. We started by examining Chicago as a case study to develop and test the model, pictured below.
Acquiring Data
This analysis can be run on any set of polygons and points, so I chose to analyze my hometown region - King County, Washington. I downloaded the Census Tract polygons from the Census Bureau Website, and downloaded the demographic information on population, race, and median gross rent from American Fact Finder. Then, in QGIS, I imported the csv table information as a table, and joined it to the census tract layer by the geiod join key.
Download this data as a geopackage
Selecting and Creating the Central Business District
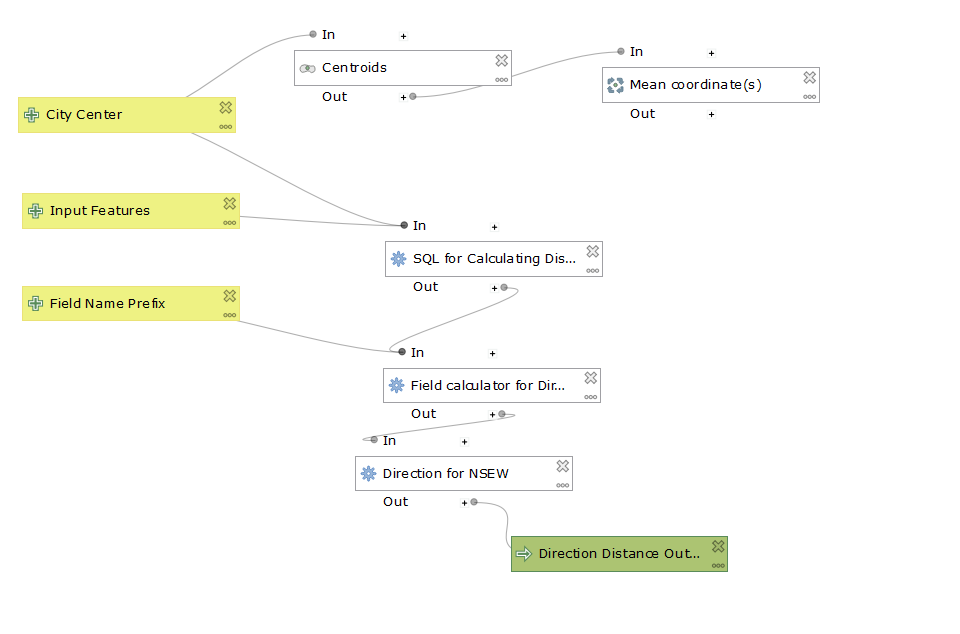
The model requires the city center input to be a point, so if you have several polygons or tracts as the city center, use this model to find the mean coordinates of the centroids, which will output a single point as the central business district. The input for tracts has to be polygons in this model. The model will transform the coordinate systems to a World Mercator projection before calculating both the distance of each tract from the CBD and the direction. Cardinal directions (North, South, East, West) are also calculated and added as an attribute. It is also important to note that for this model, no features can be selected. I used Census Tracts 72, 80.01, and 80.02 - three tracts encompassing the heart of downtown Seattle - as the three polygon inputs to create the CBD point for King County.
Analyzing the Distribution of Rent
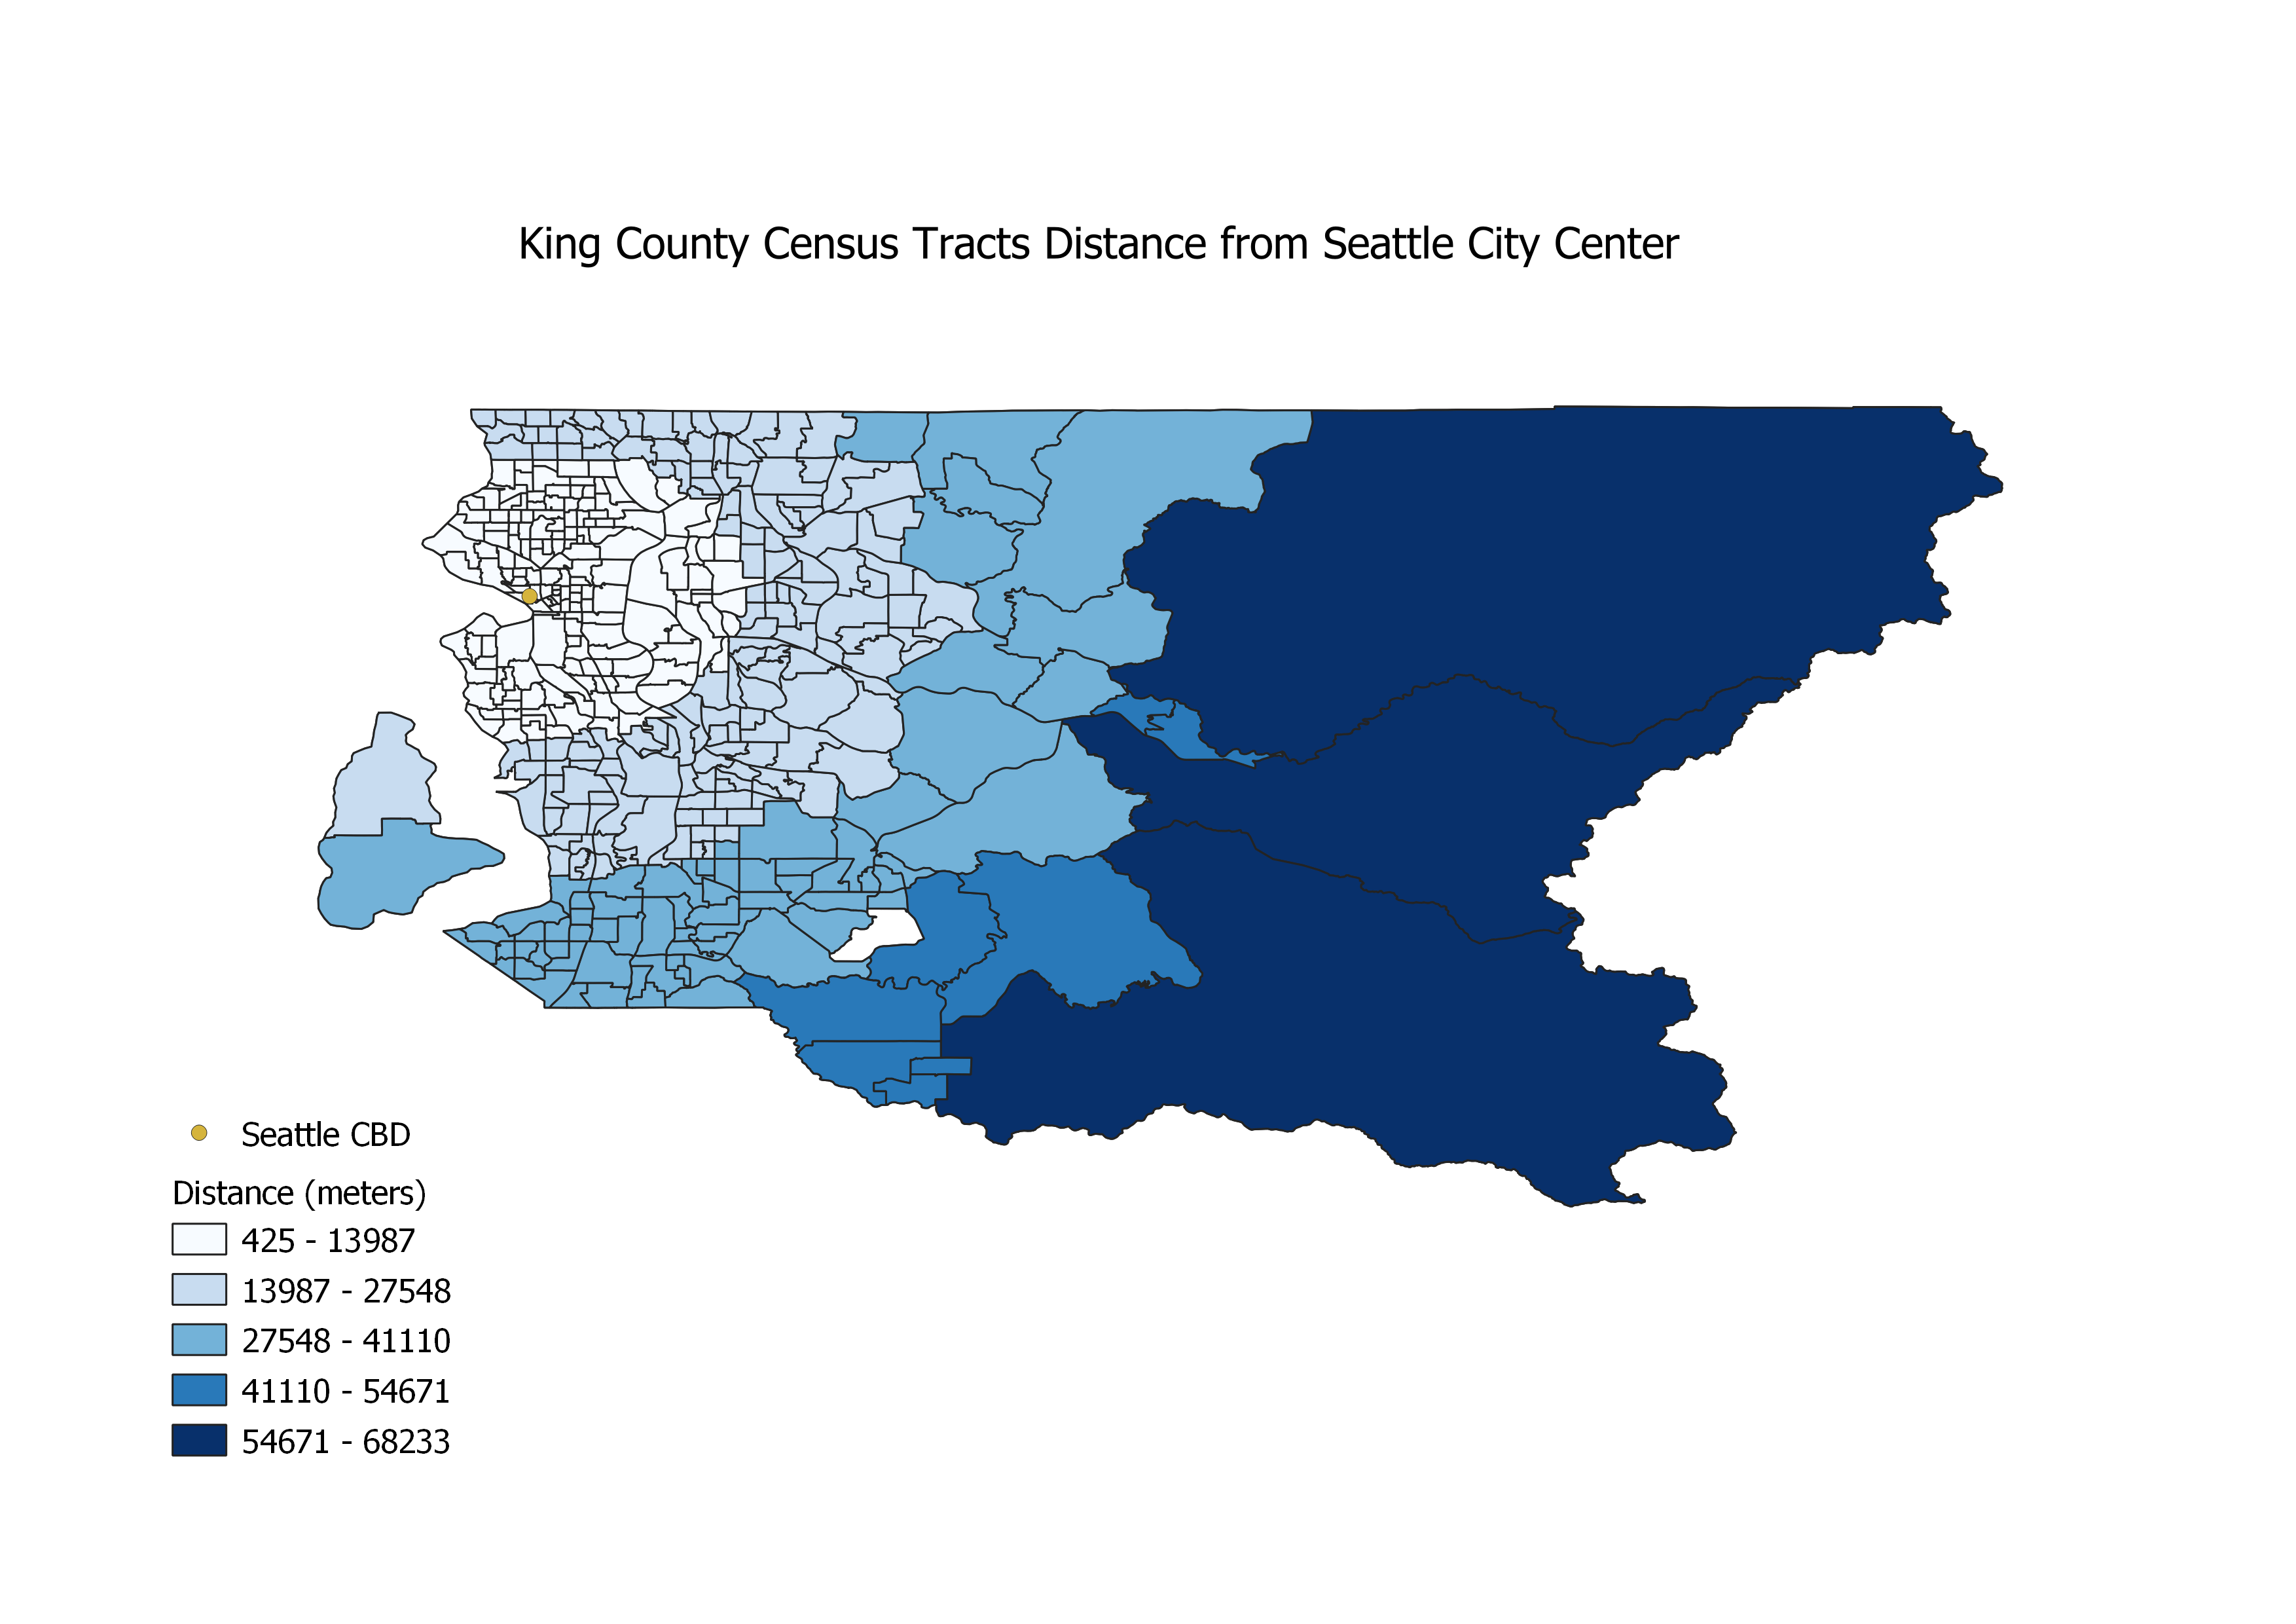
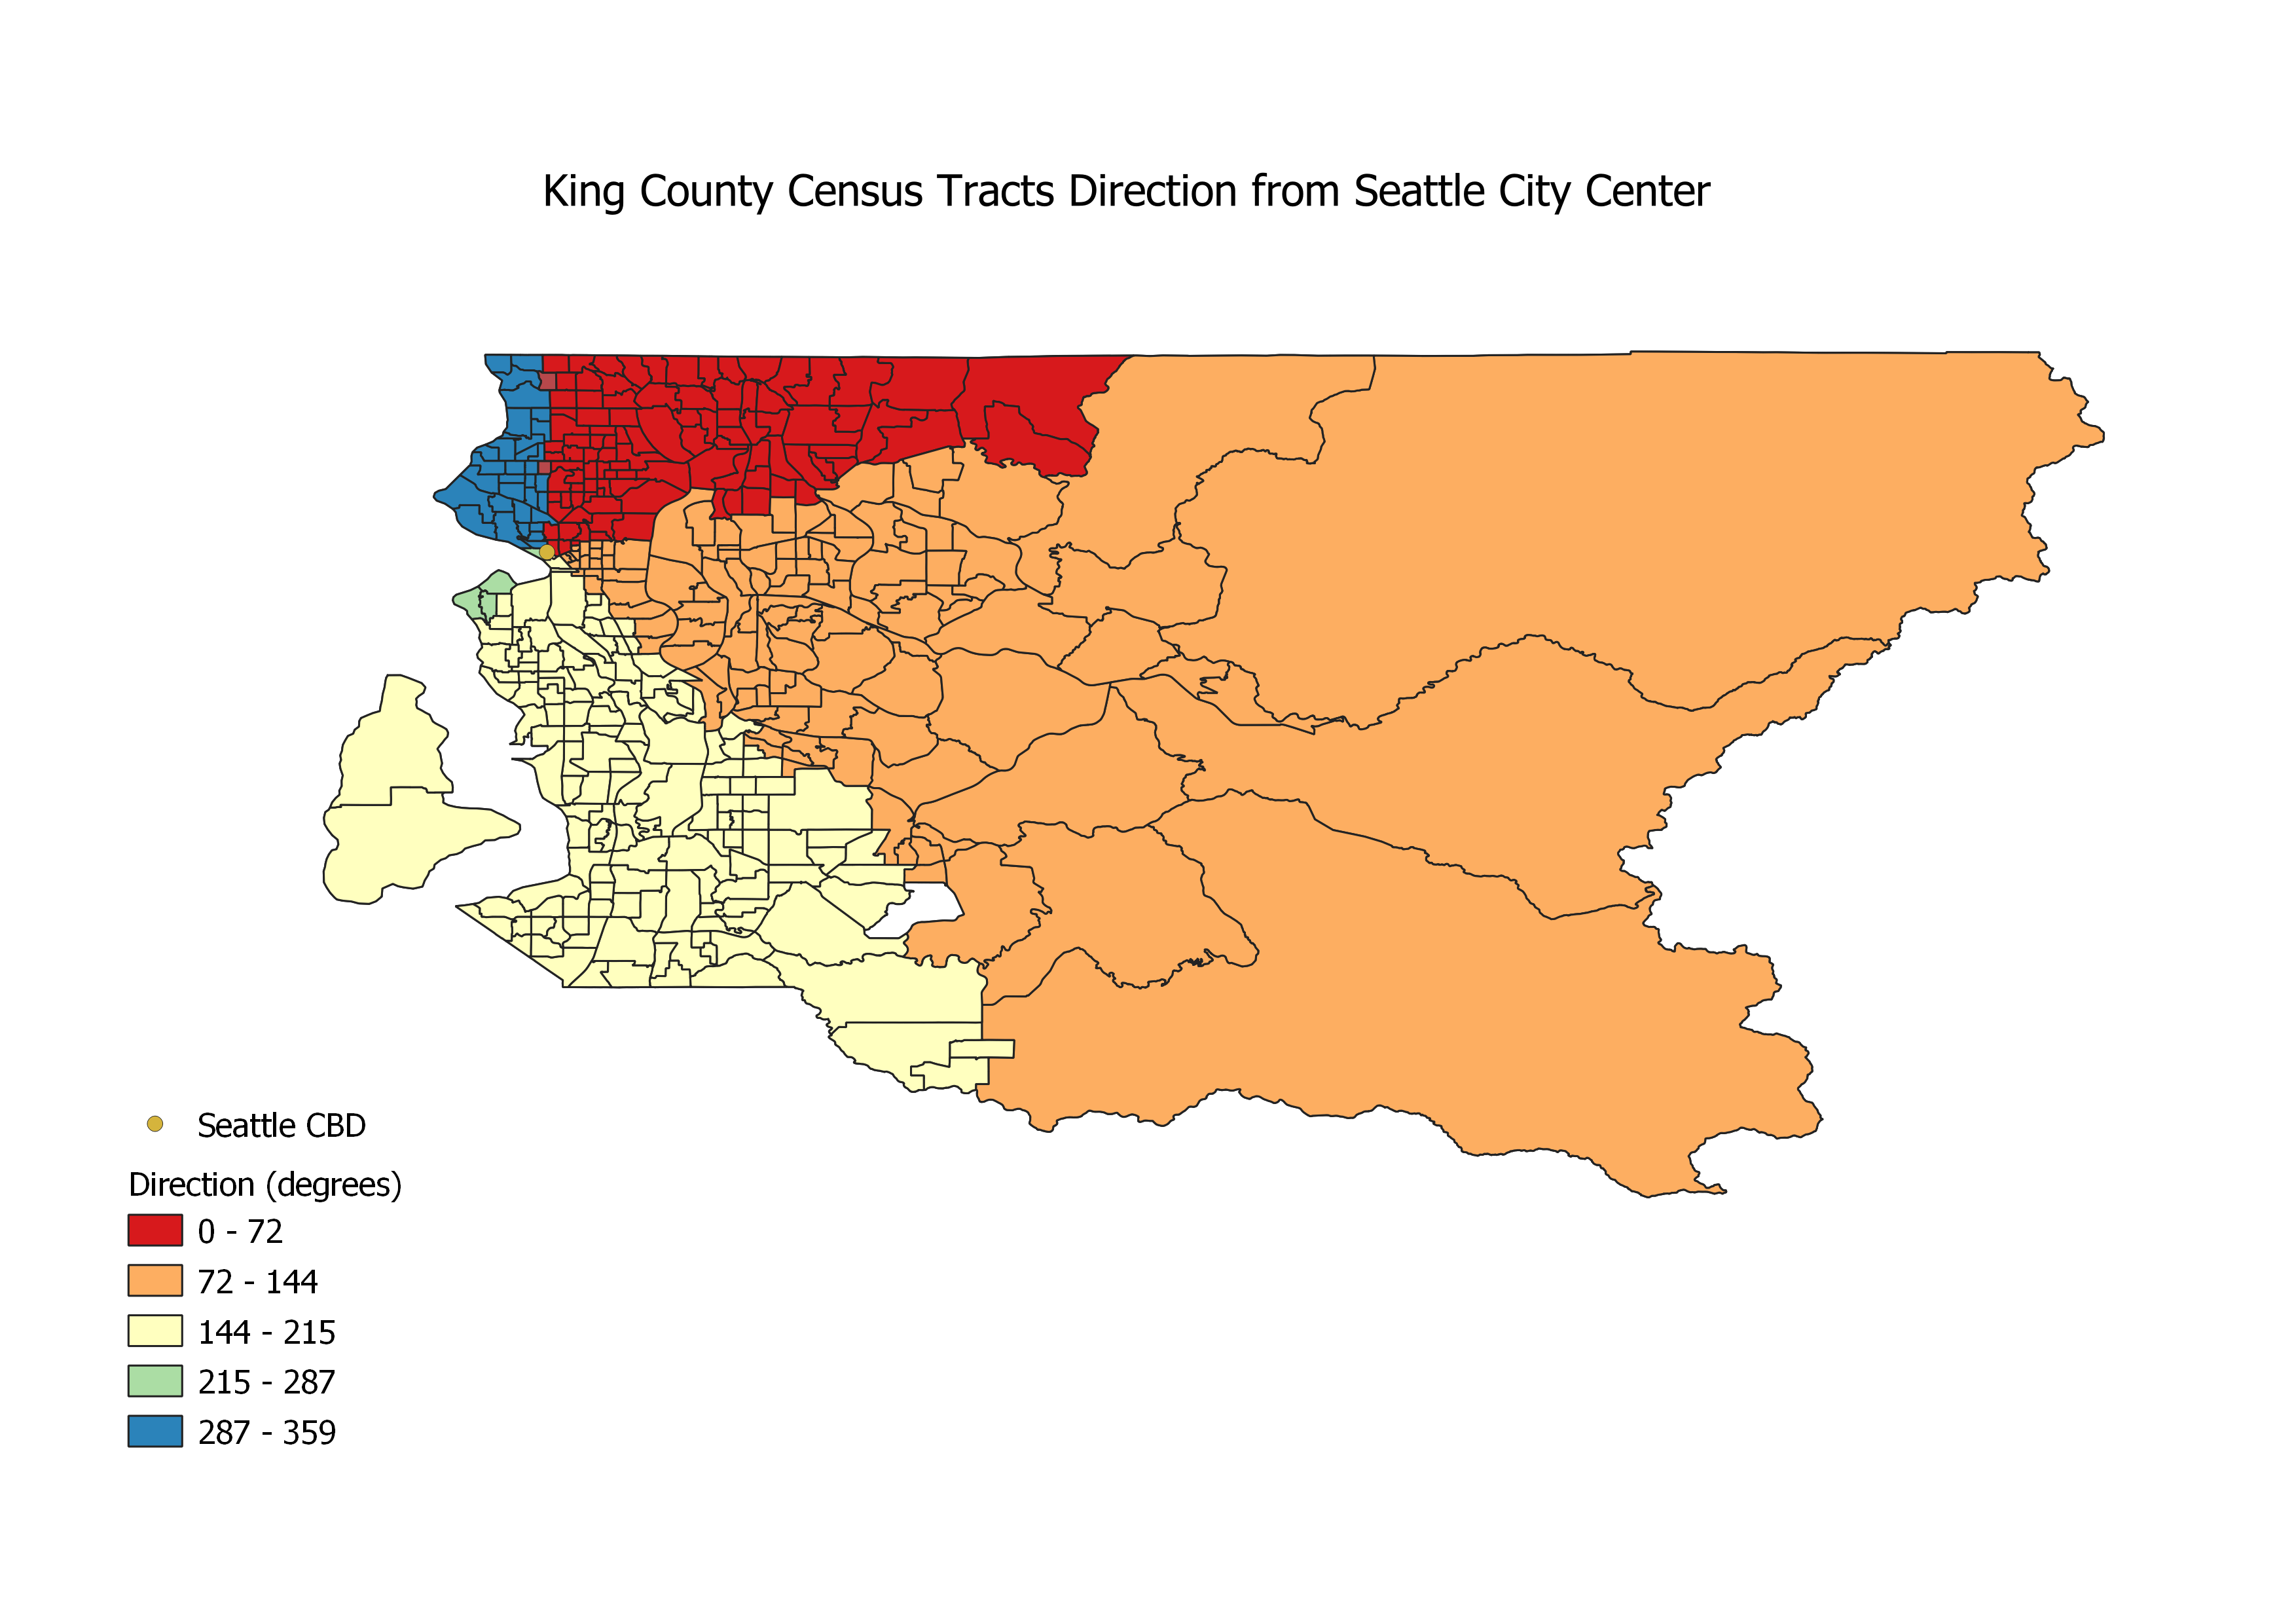
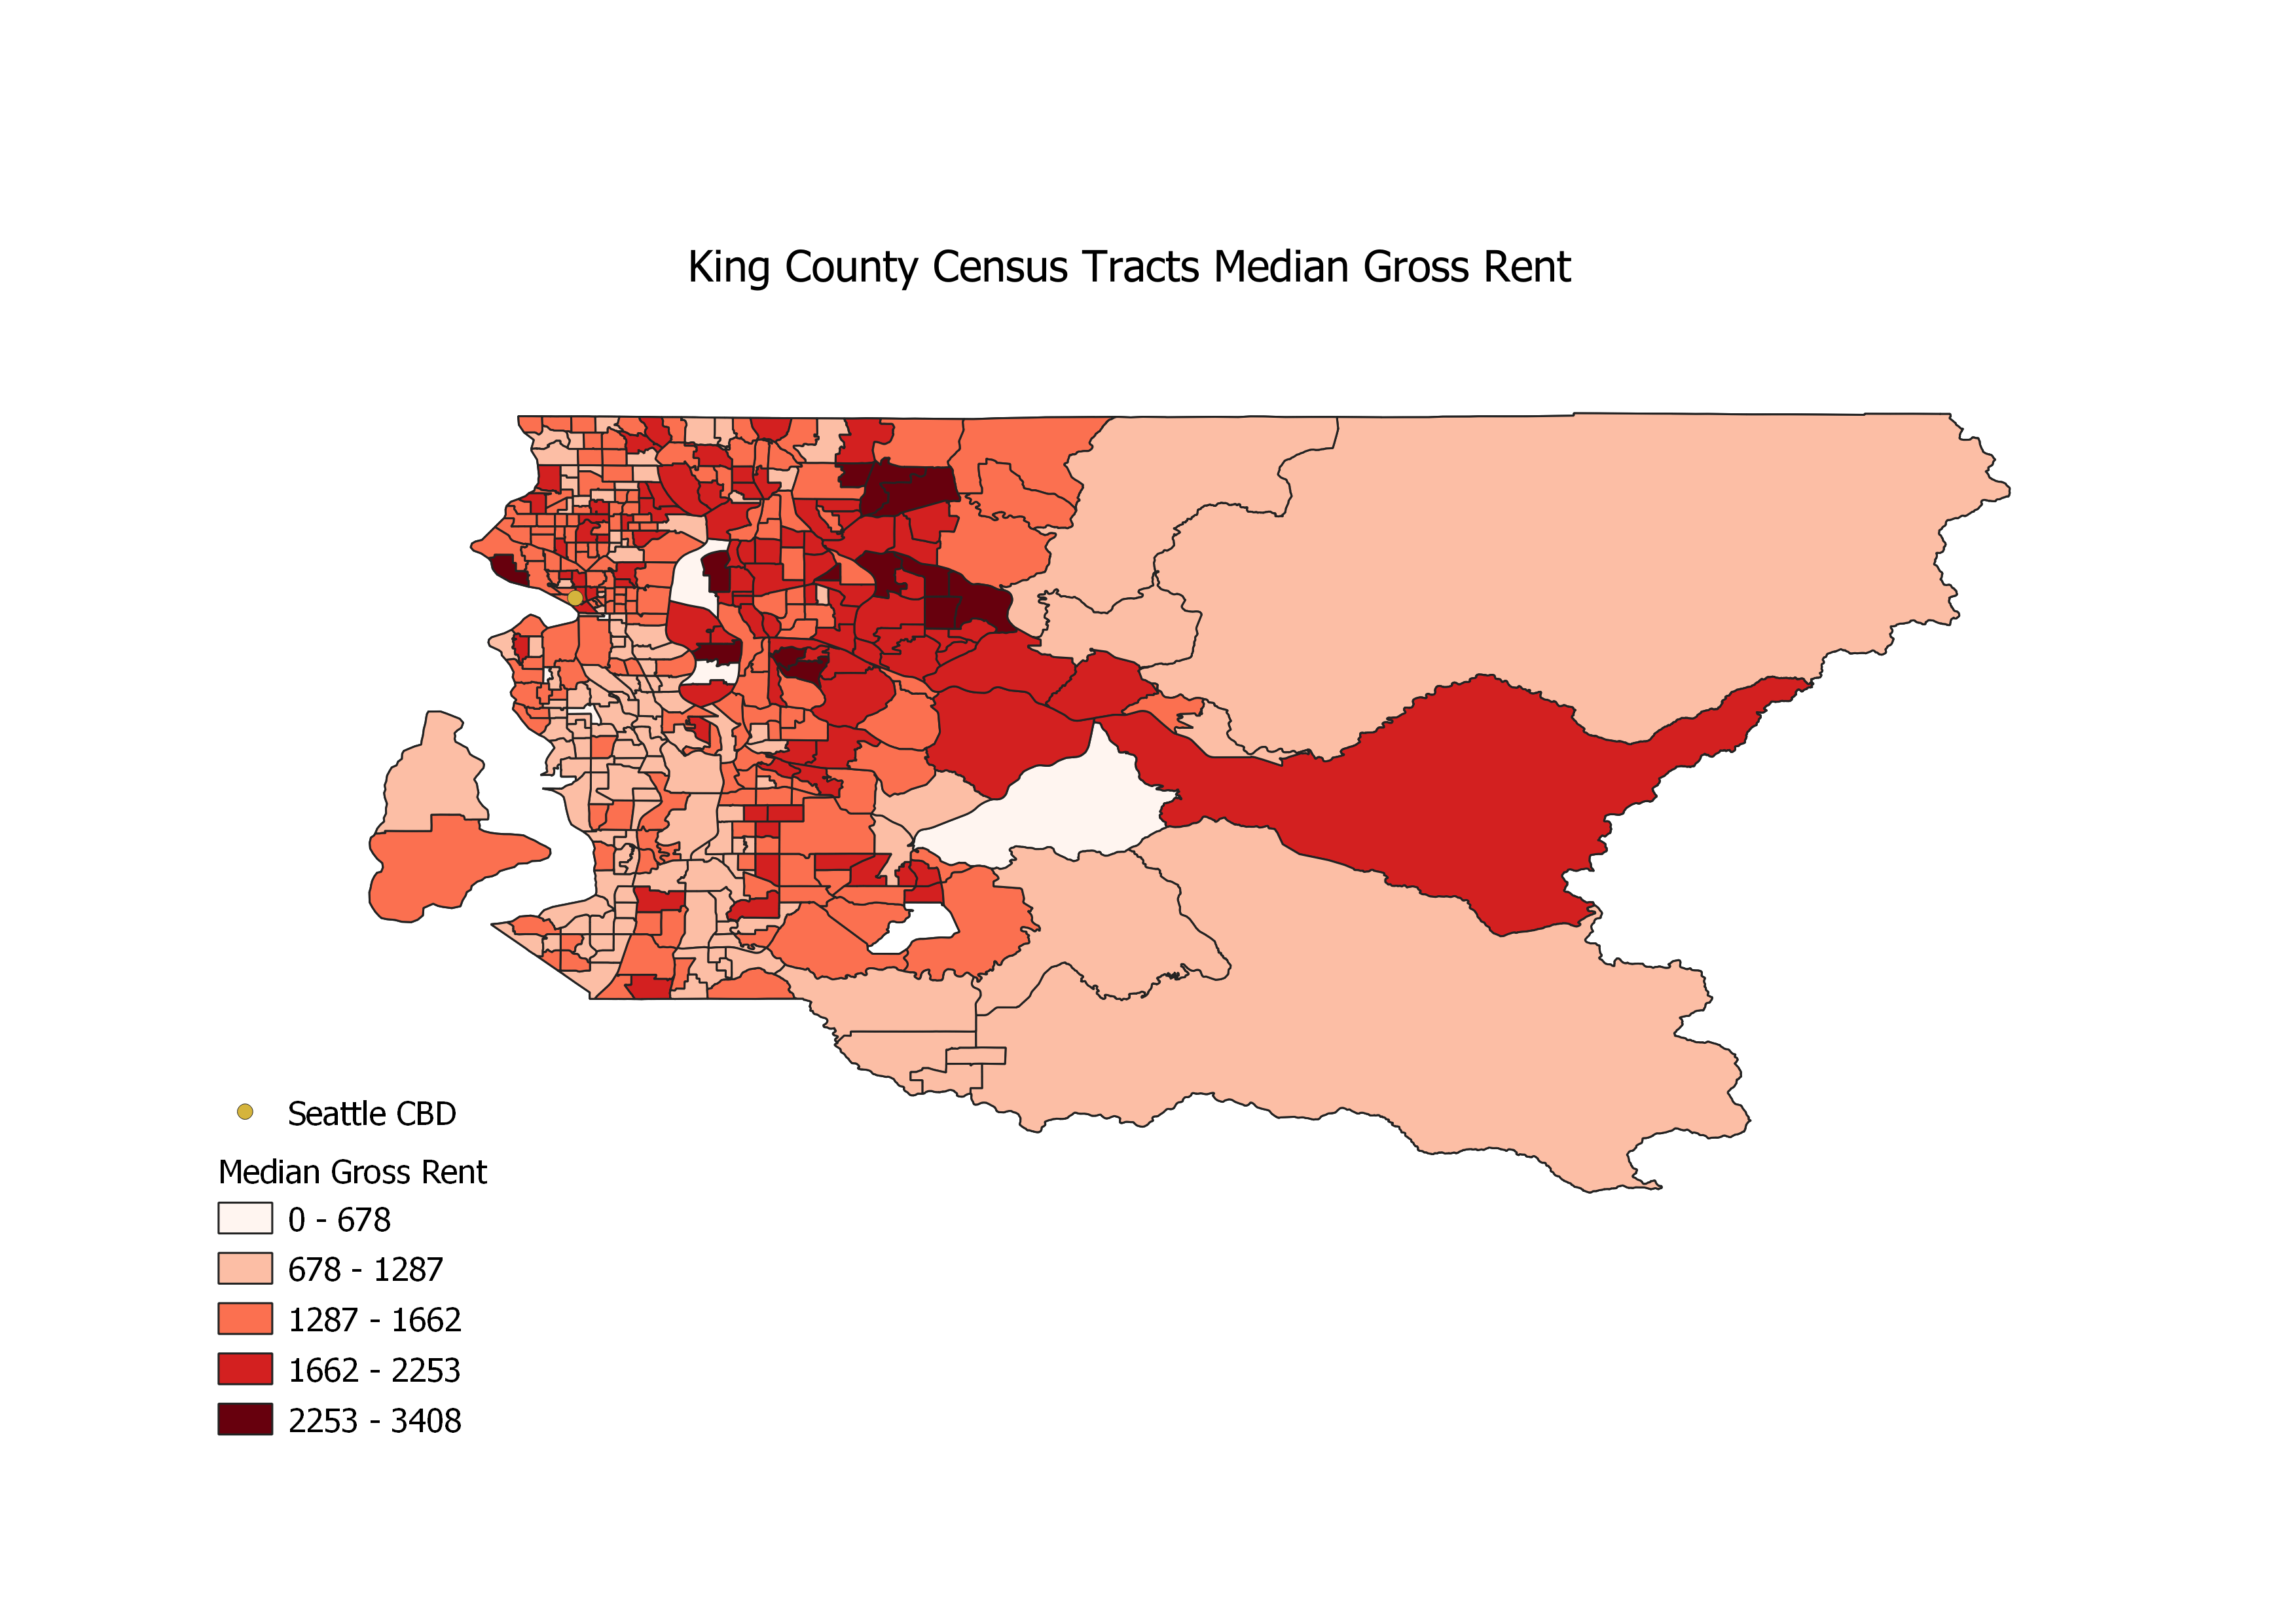
I then used this model to look at the distribution of median gross rent around the Seattle central business district. I found the CBD by finding the centroid of 3 census blocks located in downtown Seattle, and analyzed distance and direction from the CBD for all tracts in King County, WA. You can view the scatter plot of distance and median gross rent, and the polar plot of direction and median gross rent. These are the associated maps showing distance, direction, and median gross rent across census tracts in King County, WA. On the polar plot, you can begin to see higher rents to the North and South of the city center, along the metropolitan corridor. But I think to make this analysis more effective I should have selected a smaller number of census tracts more isolated to the Seattle area, rather than analyzing the whole county.
Discussion
It is important to place this model in the larger context of GIS and the Open Source community. Currently, there are several larger debates happening within geography about what exactly GIS is and what it should be used for. This model emphasizes my experience relating to GIS as a tool, rather than a science. I think primarily while thinking through the steps and manipulating the code to standardize this model, it felt more like engineering while utilizing the techniques we know. For me, most of the interpretation and critical thinking comes during the analysis of applying the tool in different situations - rather than from the model itself (Wright, Goodchild, & Proctor, 1997). Many steps in this model took repetition to develop, and were buggy initially or did not produce the expected output. To resolve these issues, I had to think on the level of the code and computer application itself, looking carefully at syntax and order. When I think about some of the more fundamental processes behind what I was modelling and why, employing theoretical frameworks and factors learned in other geography classes, I feel more like I am “doing science.” Yet these two ways of thinking - GIS and human geographical frameworks - nevertheless interact and support each other.
This speaks to some of the larger debates within geography on the role of GIS. Since the development of GIS technology in the 1960s, ESRI has dominated the market with little competition. With subsequent discussions on the purpose of geography in the 1980s, when many geography departments were absorbed into other fields at prominent universities, two main perspectives on GIS have formed (Martin & Wing, 2007). One, taken by the human geographers, dismisses GIS as a captialist and positivist instrument that is exclusive and only has one particular function. Yet proponents of GIS see the technology as powerful, practical and adding needed value to the discipline of geography. Martin & Wing (2007) propose that this divide is perpetuated by discourse throughout the discipline that continues to divide broader, more radical understandings of space and ways of knowing, and GIS mapping. However, after our class discussions and reading about the Open Source GIS community, I think there is enormous potential to bridge this divide by breaking down the discourse: both human geographical perspectives and GIS add value to knowlege production. I personally have benefitted from linking these two “sides often pitted against each other” (Martin & Wing, 2007). With an increasing community of Open Source users, I think it is likely that new forms of GIS will emerge, redesigned for different purposes and audiences (Sieber, 2004). The constant interaction and feedback from a global community of minds can push the direction of the technology; the open source community is positioned to effectively respond to the demand for a GIS as a “social tool for change” (Sieber, 2004).
References
Data Access and Dissemination Systems (DADS). (2010, October 5). American FactFinder. Retrieved from https://factfinder.census.gov/faces/nav/jsf/pages/index.xhtml.
Martin, K. S., & Wing, J. (2007). The discourse and discipline of GIS. Cartographica: The International Journal for Geographic Information and Geovisualization, 42(3), 235-248. https://doi.org/10.3138/carto.42.3.235
Sieber, R. (2004). Rewiring for a GIS/2. Cartographica: The international journal for geographic information and geovisualization, 39(1), 25-39. https://doi.org/10.3138/T6U8-171M-452W-516R
US Census Bureau. (2019, September 19). TIGER/Line Shapefiles. Retrieved from https://www.census.gov/geographies/mapping-files/time-series/geo/tiger-line-file.html.
Wright, D. J., Goodchild, M. F., & Proctor, J. D. (1997). Demystifying the persistent ambiguity of GIS as ‘tool’versus ‘science’. Annals of the Association of American Geographers, 87(2), 346-362. https://doi.org/10.1111/0004-5608.872057